
gGraph
| Definition: |
include xpGUI.e
gdx id = gGraph(rtn drid, string attributes="", dword_seq args={}) |
| Description: |
Creates a resizeable graph with one or more datasets.
drid: a function identifier that provides the dataset[s], see example and DRID explanation below. For more information on the attributes and args parameters see gSetAttributes(), and below. Returns: the identifier of the created element. |
| pwa/p2js: | Supported. |
| See Also: | gCanvas |
| Example: |
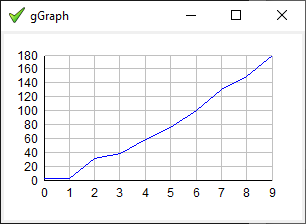
-- demo\xpGUI\gGraph.exw
-- (apart from the dialog title, the same as
--  demo\rosetta\Plot_coordinate_pairs.exw)
include xpGUI.e

constant x = {  0,  1,   2,   3,   4,   5,    6,    7,    8,    9},
         y = {2.7,2.8,31.4,38.1,58.0,76.2,100.5,130.0,149.3,180.0}

function get_data(gdx graph)
    integer {w,h} = gGetAttribute(graph,"SIZE")
    gSetInt(graph,"YTICK",iff(h>=160?20
                         :iff(h>=110?60
                         :iff(h>=90?90:180))))
    return {{x,y,XPG_BLUE}}
end function

gdx graph = gGraph(get_data,"XTICK=1,XMIN=0,XMAX=9,YMIN=0,YMAX=180"),
    dlg = gDialog(graph,`gGraph`,"SIZE=240x140")
gShow(dlg)
gMainLoop()

(there are several more screenshots below)
As shown you can also set XTICK etc inside DRID, which has been named get_data() here, and is the main reason why it gets passed the graph identifier. gGraph() does not fare well at sizes below a certain threshold, beyond which ticks might overlap or even go negative, hence as shown [DEV: wherdatden?] the use of an explicit minimum size setting is recommended. Obviously all that sort of handling and more remains open to future improvement. See also demo\xpGUI\gGraph.exw demo\xpGUI\gGraph1.exw demo\xpGUI\gGraph2.exw demo\xpGUI\gGraph4.exw demo\xpGUI\GraphR.exw (Actually just a gCanvas and not a gGraph) ? demo\pGUI\IupSampleDialog.exw demo\rosetta\9billionnames.exw, demo\rosetta\B-spline.exw, demo\rosetta\Babylonian_spiral.exw, demo\rosetta\Chi-squared_distribution.exw, demo\rosetta\Compare_sorting_algorithms.exw, demo\rosetta\Convex_hull.exw, demo\rosetta\Curve_fit.exw, demo\rosetta\Eisenstein_primes.exw, demo\rosetta\Euler_method.exw, demo\rosetta\Goldbachs_comet.exw, demo\rosetta\Perceptron.exw, demo\rosetta\Plot_coordinate_pairs.exw, demo\rosetta\Polynomial_regression.exw demo\rosetta\Modified_random_distribution.exw, needs updating, and IupGraph [***] demo\rosetta\Yellowstone_sequence.exw |
| Notes: |
Written in pure Phix hll code and suitable for automatic transpilation to JavaScript (albeit with a manual copy and paste),
which should (also) make it much more amenable to user-supplied enhancements and improvements, although at the moment it is
pretty much the simplest possible implementation.
The routine specified by drid should provide data as follows:
    {{"NAMES",name{,name..}},    -- (optional)
     {px,py[,XPG_BLUE[,style[,"MARKLINE"][,marksize]]]}} -- (multiple allowed)
The display of a legend is controlled by the (pre|ab)sence of "NAMES" in the returned data object (there is no LEGEND Y/N attribute). Each dataset is a pair of sequences of x and y values such that length(px) is the same as length(py), and can optionally specify a colour (if not provided XPG_BLACK is assumed). When MODE is "MARK" or "MARKLINE" you can also specify a MARKSTYLE, make one or more datasets MARKLINE instead of MARK, and change the MARKSIZE for each dataset: data[i][3], if present, must always be a colour, eg XPG_GREY. data[i][4], if present, must always be a (string) style, eg "PLUS". data[i][5], if present, can be either "MARKLINE" or a (positive integer) marksize. data[i][6], if present, can only ever be a marksize (and [5] must have been "MARKLINE"). |
| Attributes: |
|
| MODE |
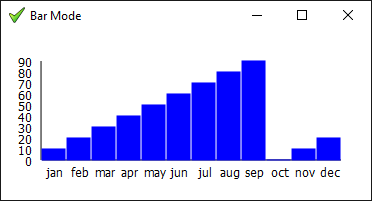
One of "BAR", "MARK", "MARKLINE", "LINE". Behaves as "LINE" if undefined or unrecognised, defaults to "BAR" if BARMODE is set. |
| BARMODE |
Display as a bar chart. Can be "VERTICAL", "HORIZONTAL" or undefined. Default: "VERTICAL" if MODE="BAR", else undefined. An error occurs if this is set to an unrecognised value, or MODE is neither "BAR" nor "" (which is then set to "BAR"). See demo\pGUI\graph4.exw for an example. |
| MARKSTYLE |
Display as discrete marks, instead of lines or a bar chart (etc). Can be "HOLLOW_CIRCLE", "PLUS", "X", "DOT", or undefined, and can be set on each dataset. Default: "X" if MODE="MARK". If you set a MARKSTYLE on the graph itself, MODE="MARK" is automatically set. However for MARKSTYLEs on each dataset, MODE must be set on the graph itself to pick them up. See demo\rosetta\Goldbachs_comet.exw for an example. |
| MARKSIZE |
A size in pixels for the marks. Ignored unless MODE is MARK or MARKLINE. As above this can also be set on each dataset. Default: 3. |
| GRID |
Display the grid lines. Can be "YES"/"ON"/true or "NO"/"OFF"/false.
Default: true. |
| GRIDCOLOR |
grid colour. Default: XPG_GREY (#C0C0C0). Should be set using (eg) gSetInt(graph,"GRIDCOLOR",XPG_LIGHT_GREY). |
|
GTITLE, XNAME, YNAME |
(optional) Text strings for the graph title and names for the x and y axis. Default: "". Aside: renamed from TITLE to GTITLE to avoid inheriting from the dialog or other container. See demo\rosetta\Yellowstone_sequence.exw for an example. |
| ? LEGEND |
[DEV] to replace the above NAMES nonsense... Sets the names to be used for a legend box. If not set, no legend appears. Can be a sequence of strings or a single comma-separated string such as "Rain,Wind". |
| LEGENDBOX |
Specify whether to draw a box around the legend, default: YES. As noted above the presence or absence of a legend explicitly depends on "LEGEND" being specified. |
| LEGENDPOS |
legend box position. Can be: "TOPLEFT", "TOPRIGHT", "BOTTOMLEFT", "BOTTOMRIGHT", "BOTTOMCENTER" or "XY". Default: "TOPRIGHT". For XY the position must be specified via the LEGENDXY attribute. |
| LEGENDXY |
(untested) legend box position in the format "x,y", with the first text being shown XPG_SE of that point. |
|
YMIN, YMAX |
The range of x and y values. Fairly obviously XMIN should be <= min(px) for all datasets, and similar rules
for the other three, otherwise parts of the graph may end up missing. |
|
XMARGIN, YMARGIN |
Can be used to adjust the axis display when needed. Specified in pixels, default 10. |
|
XYSHIFT, YXSHIFT |
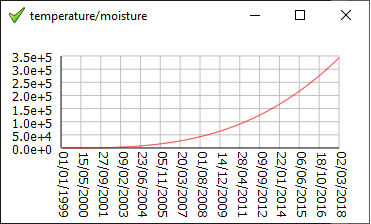
Can be used to further adjust the axis display in a platform-specific manner when needed. Specified in pixels, default 0. See demo\pGUI\graph2.exw for an example, without XYSHIFT the dates on the x-axis were misplaced under pwa/p2js. (In an ideal world IupGraph.e would handle that sort of thing automatically, perhaps. There may yet be a need for XXSHIFT and YYSHIFT.) |
|
XANGLE, YANGLE |
Specify an angle in degrees suitable for passing to gCanvasText(), default 0. A non-zero value rotates the tick labels, currently only +/-90 are supported, with align/rotation point automatically selected internally. See demo\xpGUI\gGraph2.exw for an example. |
|
XACROSS, YACROSS |
Allow the axis to cross the origin and be placed inside the dataset area. Can be true/"YES"
or false/"NO". Default: false. See demo\xpGUI\gGraph1.exw for an example. |
| XTICK, YTICK |
The spacing between major ticks, as in `for x=XMIN to XMAX by XTICK do draw_tick(x) end for`. (minor ticks have not yet been attempted) |
|
XTICKFMT, YTICKFMT |
Specify a standard sprintf() format string for the tick labels. Default: "%g". Has no effect if XRID/YRID has been specified. |
| Also: |
? ACTIVE,
EXPAND (see note),
FONT,
MINSIZE,
MAXSIZE,
TIP,
SIZE,
SCROLLSIZE,
VIEWPORT,
VISIBLE. |
| Handlers: |
You may not use or override REDRAW,
however you can draw on the blank graph canvas at the start of the
DRID function, or tweak any drawing operation in a
IDROP intercept, or draw on/save the finished graph in the final
POST handler. |
| DRID |
A function that provides all the data needed for drawing the graph.
function drid([gdx graph]) graph: (optional) identifier of the graph element. Should return a sequence containing one or more datasets, and can optionally perform some further settings on the graph gdx. Usually specified on the initial gGraph() call that creates the graph, but can be NULL and set later in the usual manner, being specifically here gSetHandler(graph,"DRID",drid), however a fatal error occurs should the data fetch function (still) be NULL when the graph is displayed. Note this is invoked on every redraw/resize, so the results of any lengthy operation should be cached. See demo\rosetta\Babylonian_spiral.exw for an example where the results are not only cached but also supplied incrementally, so in that case you can explore the smaller sets while it is still (visibly) churning away up to the full 200K set. |
|
XRID, YRID |
(optional) Specify a routine_id to use as a handler for formatting the tick labels.
function format_xxx(atom d) See demo\xpGUI\gGraph2|4.exw for examples. Note the x and y elements must all be numbers, not, for instance, date() results, and these routines have to be able to decipher said numbers. In the case of gGraph2.exw, the x values are days since 1/1/1999, in the range 1..7000, though these routines actually get their (atom/integer) parameter from the (matching/equivalent) XMIN/XTICK etc. In the case of gGraph4.exw, the x values are 1..12, with format_month() yielding "jan".."dec". |
| POST |
An optional post-drawing handler, invoked after all other drawing of the graph has finished.
procedure post(gdx graph) graph: (non-optional) identifier of the graph element. You may perform additional drawing operations on the graph, or perhaps save it somewhere/somehow. |
| also | CLICK, IDROP, KEY, MOUSEMOVE: All common handlers are supported. |
|
|

|